Housing information is a popular environment where to play with data. In Helsinki - where I live - there are about a thousand rentals available at any given time. And if one takes into account the neighbouring cities of Espoo and Vantaa, which together constitute Finland’s capital region, the number adds up to a couple thousands. These data can be easily crawled over and scraped using Kimono labs tools.
I extracted the information related to price, size, description and address. I was especially curious to see how they are distributed geographically, since the original portal does not provide any map visualisation, but the geo-coordinates are missing in the original data. To generate them one has to first clean the data, which does not come out as neat as one would like it to be but, although slightly tedious, it can be easily done with R - you can see how I did it here. Once the address field has been cleaned, it can be used to generate the coordinates of each rental location using the geocode function within the ggmap package. The same package allows also to plot several types of maps using latitude and longitude coordinates; however, a more interactive and flexible alternative are leaflet maps, which can be used straight in R via the leaflet package.
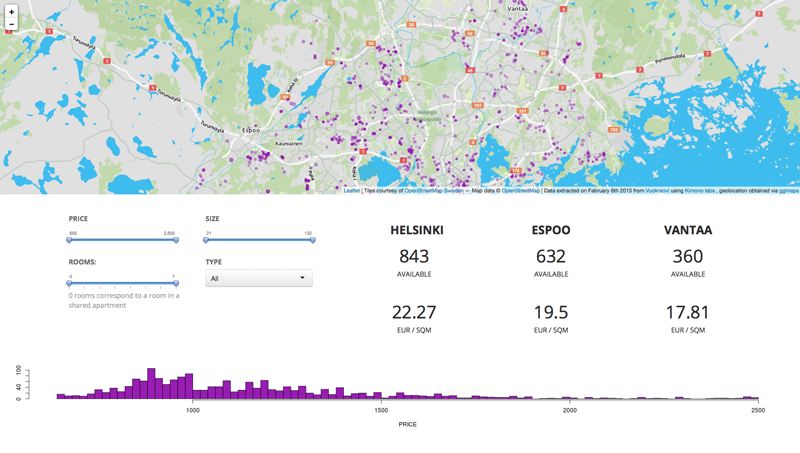
After extracting and cleaning the data available on February 3rd and 12th, I put it all together in the shiny app that you can see below, which displays static content but could be easily developed to provide live results.
A brief analysis
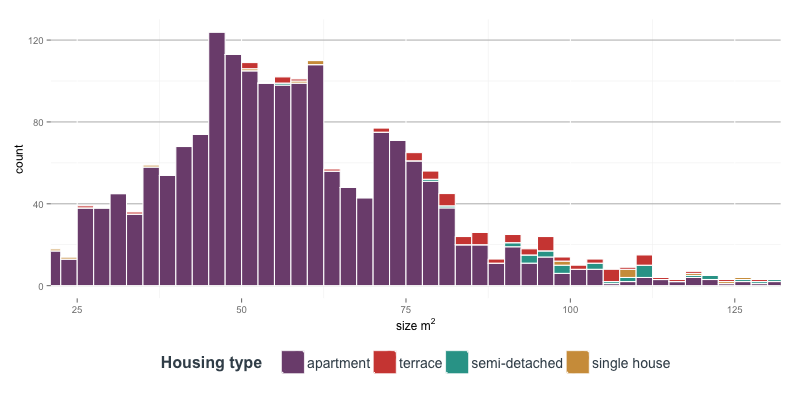
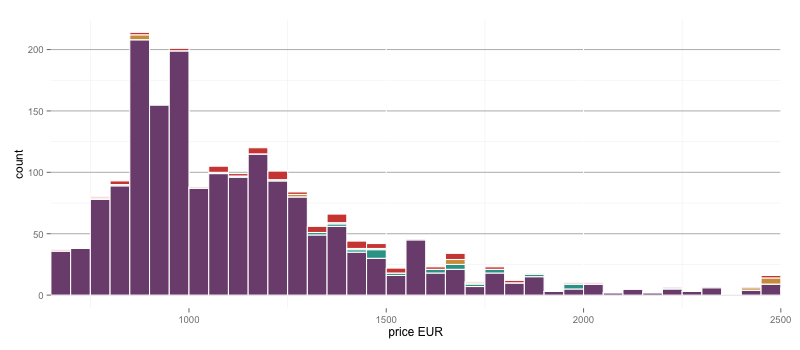
The data captures the rentals offered by several real estate agents but it has been extracted from a single portal at only two different points in time so it definitely does not provide an overall picture of the housing market in the area. Additionally, I have restricted the values to the central 95th percentile to remove the distortions introduced by extreme outliers. Bearing that in mind it is still interesting to have a look at the distribution of price and size. The vast majority of rentals correspond to apartments in the range of 50 to 60m2 and there seems to be an interesting price barrier at 1,000 EUR per month.
Regarding real estate firms, SATO seems to be a dominant player since it deals about 25% of all available rentals - at least at the moment when these data were scraped. It is also interesting to notice the fact that a fair percentage of the rentals available, about 13%, is composed by small firms, associations and societies not directly involved in real estate and private individuals, which I packed together under the category Other.

This is a static view of the market. Nevertheless, using this same approach and tools it would be easy to follow up the market development by periodically collecting scrape results.
Find the R code on GitHub.